
Science
|
|
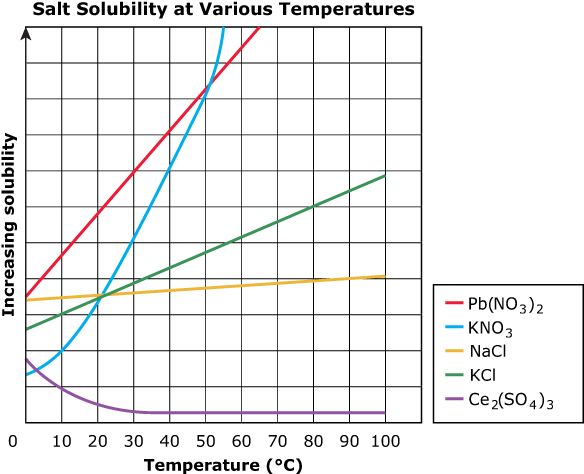
Multiple Choice Item: 1 point valueQuestion Overview:This question requires you to select the answer supported by the data provided in the graph, representing the correct scientific relationship between increasing temperature and solubility for a specific salt. This question tests your skill in representing a scientific relationship in words. Answer Rationale: Option A is incorrect. If you chose option A, you probably noticed that for most of the salts, the solubility increases as the temperature increases. However, a closer look at the graph illustrates that Ce2(S04)4 does not show that solubility increases as the temperature increases. Option B is incorrect. If you chose option B, you probably noticed that at 40 degrees Celsius, KCL (the green line) has a higher solubility than NaCI (the orange line) and Ce2(S04)3 (the purple line). However, a closer look at the graph shows that Pb(N03)2 (the red line) and KN03 (the blue line) have higher rates of solubility than KCL. Option C is correct. If you chose option C, you noticed that the rate of change in solubility of KN03 changes as the temperature increases. The curve in the KN03 line demonstrates that solubility does not increase at a constant rate as the temperature increases. Option 0 is incorrect. If you chose option D, you probably noticed that the line representing NaCI, at 80 degrees Celsius, is almost horizontal. However, a closer look at the graph shows that there is a slight increase in the NaCL line at temperatures above 80 degrees. |
Flag For Review |
|
|
This is the flag for review button. If you are not certain of an answer to a question, you can use this button to mark your answer. At the end of the test, you can to return to the question using the "Question Review Screen." |


